Impact of events and trends on Amazon
On Amazon you can buy almost any product nowadays, including food. Indeed you can buy your groceries on Amazon and you can see users's ratings of the food item you're looking at. This of course changes the consumer's behavior. However, how much of an impact does it have on the consumer? In particular we know that people tend to be deeply affected by group effects, such as festive events. Indeed, Christmas or Valentine's day have a big impact on sales, is it possible to quantify it using reviews? There also are food trends such as veganism or specific diets, can we also observe an increase here?
We want to study the impact of events and trends. Events such as Christmas, Easter or Valentine's Day and trends such as veganism or diets. This will give us good information about the change in both user and product behaviour depending on the events. There are many interesting questions one could think of, to analyze this subject we selected 4 questions we want to focus on and we'll answer them here just for you!
- What food trends can we observe? Can we detect evolutions?
- How much of impact does an event have on what the users are talking about?
- How much of impact does an event have on the sales?
- Any weird phenomenas we can catch? Mainstream event outside of food topic? Fake commercial reviews?
The data we use comes from Amazon reviews from the "Grocery and Gourmet Food" category between 2000 and 2018, it contains 5'074'160 reviews, which come from American users. We also have metadata about the products the reviews are about.
However, we thus don't directly have access to what users bought. So we must be careful as we can't analyze what people purchased but only what they are reviewing. The information we have access to is indirect and it's more tricky to process it. We'll see that we can still get interesting insights from this. In fact, reviews contain much more information than just the sales as we can know what people are talking about during a specific event. The context can be infered and that's of great value.
Example of a review:
Here you can see the number of reviews we have for every day:
Before 2012 there are basically no reviews, that's why we didn't plot it. In 2018 (when our data set ends) it slowly decreases from May until there are no more reviews instead of dropping suddenly. We can also notice that it doesn't increase smoothly the number of reviews changes throughout time; this may be due to events! We can also notice that there are more reviews around December/January then it sort of decreases and peaks again. This makes sense since there are a lot of festivities during winter. We'll put the festive events on hold for now, so be patient. Let's see what trends we can get first!
Food trends: the case of veganism and special diets
Veganism
Among all the food trends that exist nowadays, the most controversial one is clearly veganism. This trend has gained a lot in popularity during the recent years. It is strongly assosciated to the climate change debate and movement. We all know famous activists in this field such as Greta Thunberg; there also are a lot of manifestations. This makes it a interesting study case. We'll thus try to quantify the veganism evolution:
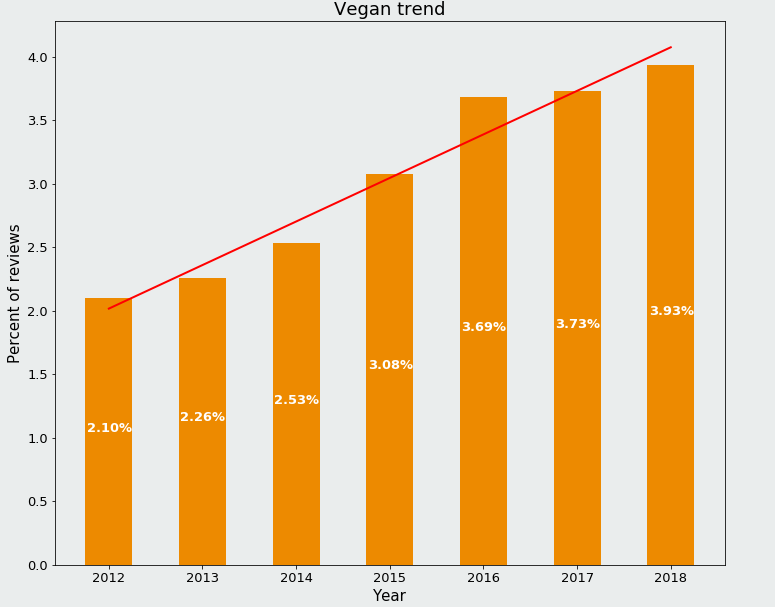
This plots the percentage of number of reviews that are for vegan products over the years. How do we know if a product is vegan or not? We could have used machine learning to classify products but a good old keyword-based analysis works very well in this case. A product is vegan if it contains the word vegan, this provides good precision and decent recall. The red line represents the linear regression of the found values, we did an hypothesis test with null hypothesis being: the slope is zero. We found a p-value of 0.000146, so we can fairly soundly reject the null hypothesis. With all of this it would seem that the vegan trend indeed increased quite a bit during the years. It has nearly doubled from 2012, indeed vegansim is a very hot topic nowadays. Both in food and political topics !
Special diets
We can also look at other kind of diets, that are maybe less controversial but still interesting, are 'paleo-like' diets. The specific diets we are looking at are "paleo", "keto", "ketogenic" and "atkins", these diets are mostly about eating nutritious food but trying to reduce glucide consumption. They are thus very different from the vegan diet, the paleo diet's goal is to eat more like cavemen. Meaning a lot of animal food: meat, eggs, cheese, and so on.
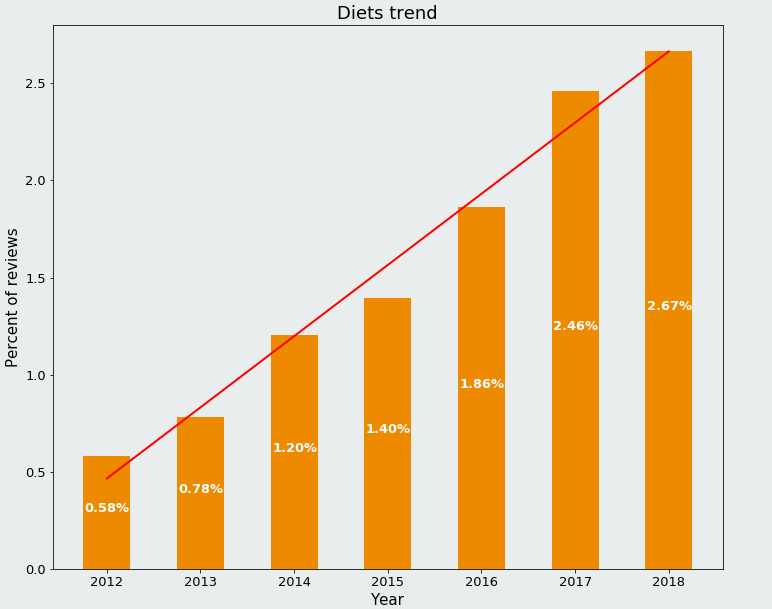
We can see that there is a surprinsigly big increase during the years, it has multiplied by almost 5 times! Maybe this is simply some kind of hipster effect: who doesn't want to eat like a caveman ? However, it can also be that people want to have a fancy and personnalized diet or that diets are the new way to feel like you have more control and freedom over your life. But this would require further analysis and it isn't the goal of this subject so we won't drill deeper on this axis. We'll instead dig out the festive events we put on hold and see what they can tell us.
Impact of events on users
To gain insight about those events, we analyze the frequencies of words present in reviews of products that are popular during the period of the event. The idea is that a product that is abnormally popular during an event compared to the rest of the year will somewhat reflect what themes characterize it and thus the people reviewing it will talk about these themes, in most cases. So for each event, we'll visualize the themes by looking at the words whose frequency differ the most outside and inside the period of the event. This approach will allow us to analyze the users's behavior during an event. This section can be a good start if you want to create a succesful product for a specific event!
Valentine's Day
First, we'll take a look at Valentine's Day, the famous feast of love and romance.
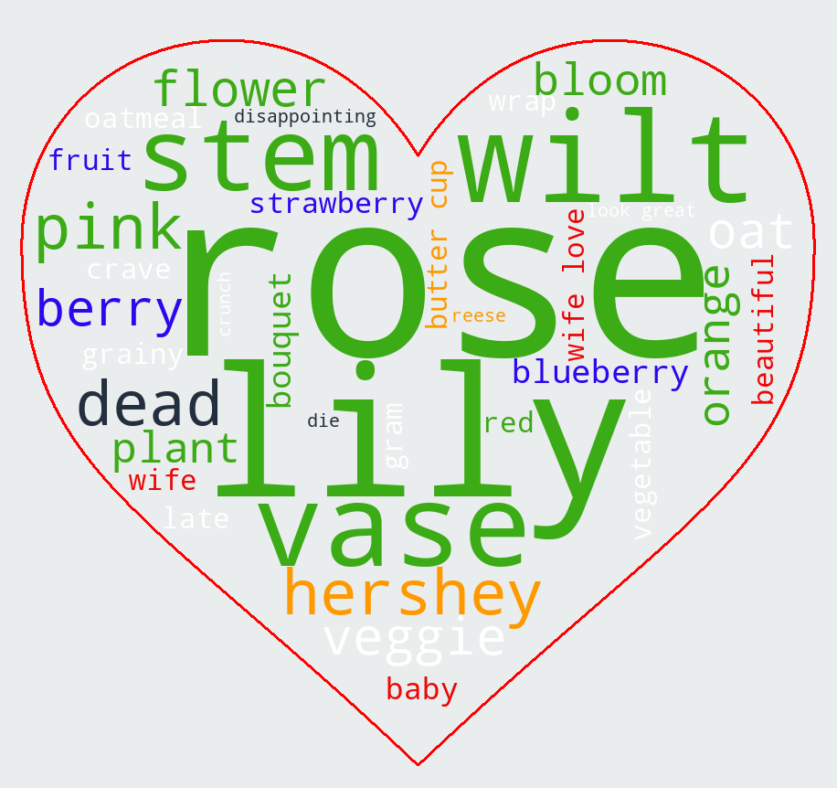
Note: we removed 'Valentine' and 'Valentine day' from the words in the wordcloud as they were too big and hiding the other words, while giving low insight.
Here, we can see the visualization for Valentine, the size of the word represents its importance and we colorized the words belonging to the same theme together. We can see 5 major themes emerging from the picture. In green we have the flowers and plants, in particular roses and lilies which are famous representatives of love, timelessness and passion. The second theme that pops out is the orange theme, which represents chocolate and sweets. Indeed, Reese and Hershey are popular brands of chocolate and sweets maker; Reese is especially popular for having huge sales during all festive popular events. This may also be why Reese is tiny; it's not cited a lot more during Valentine's than the rest of the year, since it's always popular. Indeed, how could you resist a creamy butter cup for Valentine to sweeten your day? The blue theme, containing fruits, is, in our opinion, surprising. Even though, fruit baskets as gifts are a thing for Valentine it doesn't really strike us as strongly correlated to it. But maybe, you, the reader, have a good and reasonable idea of why it could be present here? Next, the dark blue one, is also surprising at first, however there is in fact a very good reason for it. You can get a hint of why it is here, indeed in green you have the word 'wilt'. Let's see it in action!
- “I received about 8 wilted bendy tulips stem with half dead looking leaves more leaves than tulip I must add”
- “These flowers are such a disappointment. They are skimpy and dead. I am extremely disappointed.(no stars are deserved)”
- “Sorry but very disappointed get something for Valentine's day to show the love to my wife and it comes in deadly conditions”
Last but not least, the red theme, maybe you thought it would the biggest one: the theme representing love and family. However, we are working with reviews so the people will usually talk more about the product and I hope your wife is not for sale on Amazon. This is probably why the theme is not predominant here. But it is interesting to see that we could still capture it, meaning that it strongly linked to Valentine.
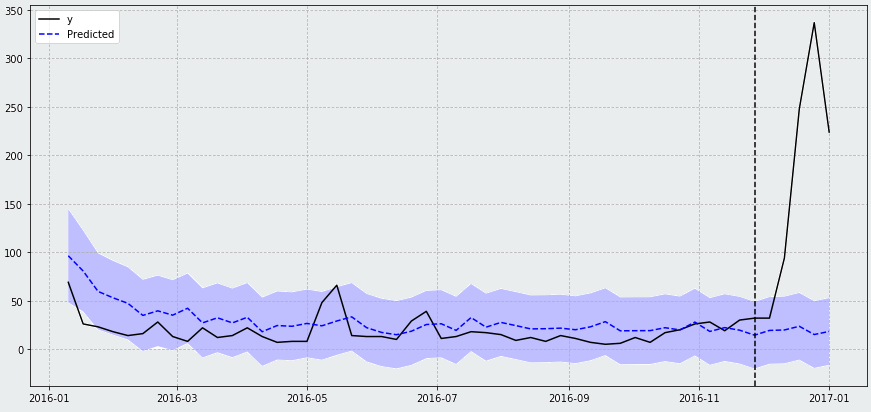
Christmas
Here, we choose the month of december with probably the biggest commercial feast.
There are four themes that stick out, the first and biggest one being gifts and presents. We can see that people tend to offer a lot and it is not surprising given that Christmas has a huge economical weight. Next, we can see more precise and specific Christmas words such as stocking stuffer or xmas. Then, we have a theme related to food that people tend to consume for Christmas. Indeed, there is, for instance, a few words assosciated with bakery such as glaze or fruit cake.However we should pay attention to those sensitive words who debatably belong to Christmas. "Beef" is indeed strongly present in Christmas recipies, but it could also be present for another reason. Finally, there a last theme linked with family that is surprinsigly not so present here. Since, we only keep the fifty top words, maybe the rest of them is drown below.
Impact of events on products
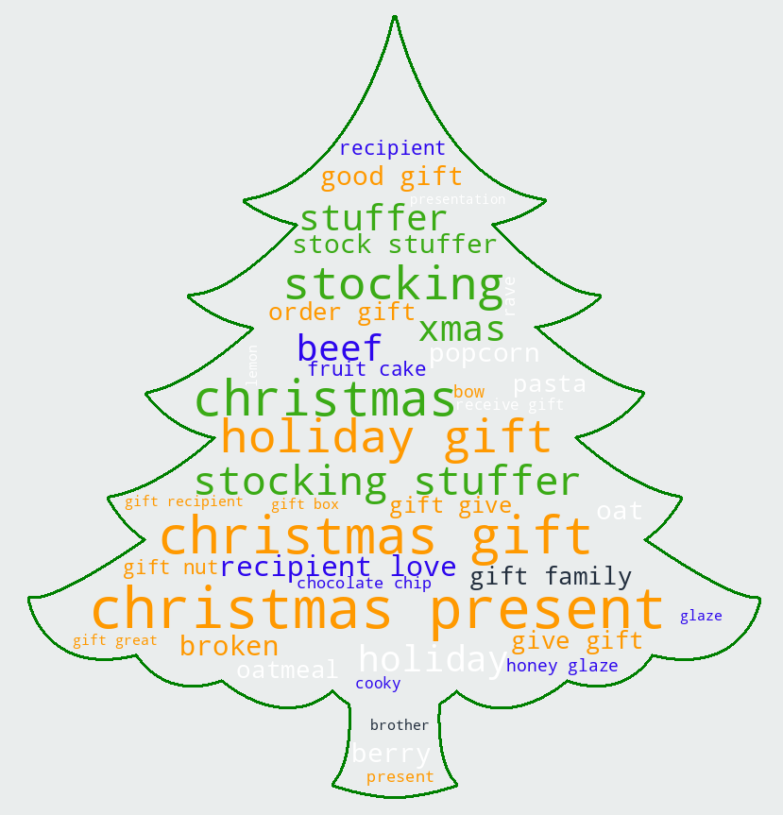
Whereas, the analysis above shows how events affect the user behaviour, we could ask ourselves what products are affected and how much they are. We again start with Valentine's day and recall, that the predominant theme was about flowers. Therefore, our choice of product, from which we want to investigate the sales during Valentine, falls upon a romantic bouquet from the brand Kabloom and we want to know whether Valentine's day has indeed influenced its popularity. We use here statistical bayesian inference in order to do so. Consequently, we arbitrarily choose other bouquets that were not affected by Valentine's day among the products on Amazon so that we can predict what would have happened to our lovely kabloom flowers in the absence of the event. Let's cut to the chase and dive in the first plot! The black line "y" represents the popularity over time of the kabloom romantic bouquet and the blue dotted is the prediction of the latter computed using the other related bouquets that were not affected by Valentine's day. Finally, the vercital dotted line symbolises the start of the event and the y-axis represents the number of reviews.
We directly notice that the kabloom bouquet is strongly affected by Valentine's day since it has a sudden huge increase at the beginning of february 2017. On top of that, the model predicts a flat blue dotted line which means that the kabloom flowers' popularity would have stayed really low without the intervention of the event, which is good news! Nevertheless, we should be cautious about the interpretion of what we obtained because even if the results seem to be statistically conclusive, the premises may be wrong. Indeed, we arbitrarily chose other products that were not affected by Valentine's period of time in order to show what effect the event can have on the Kabloom romantic bouquet. Consequently, the correlation between the kabloom flowers and the other products we choose for its prediction is crucial. We could have taken other products, such as potatoes, that have a rather flat line and could have got the same statistical results, but in that case the interpretation would not make sense. Fortunately, we conscientiously picked our products. Indeed, they are all bouquets, so flowers that are very often offered and among them we even managed to have another product from the same brand Kabloom. Phew! That was close!
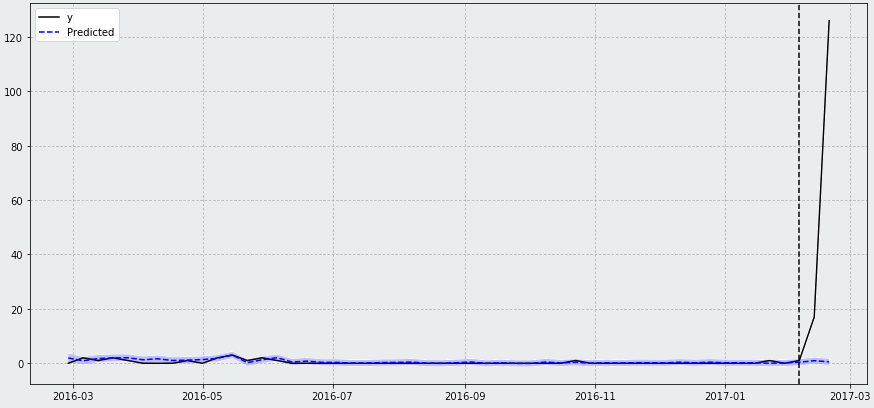
Now let's drill a little deeper with another product, but this time from Christmas. We select here a holiday nuts gift basket as the product that we suspect to be influenced by Christmas. And in order to predict what would have happened to it without the intervention of the event, we pick different sorts of nuts: dry roasted peanuts, brazil nuts, dark chocolate nuts and so forth. We again use bayesian structural inference and plot both curves.
Here, the result is a bit different from what we obtained before. The blue area round the dotted line, represents the interval in which the model is almost sure about the value of the line. We can interpret it as its variance. You might have missed it on the plot of the kabloom romantic bouquet, because it was significantally small. So what can we conclude? The first plot is very sure about the prediction it computed and that Valentine's day has a big impact on the product. Regarding the second plot, whereas the model is perfectly sure that there is indeed quite a big impact, it is however not sure about how big that impact is. The intuition behind it is that Valentine's products are very specific and not that numerous. Indeed, we can think of flowers, chocolate,teddy bears and maybe a few more, but we quickly run out of ideas. Whereas Christmas has a huge pool of products, so nuts only consist in a small fraction of what people buy. Moreoever, specific products for Valentine would tend to prodive a sudden abrupt change because they are strongly linked to the event, which is not the case regarding nuts that quite popular all year long.
Most popular event
Now that we have seen what was hidden behind those events, let's compare them. To achieve this we have used the same approach than for the food trends. We first make a small pool of words using Word2Vec, an algorithm that allow us to find words similar to others, and check for the presence of words in this pool. That gives us the opportunity to visualize well the evolution of the events and their importance through the year.
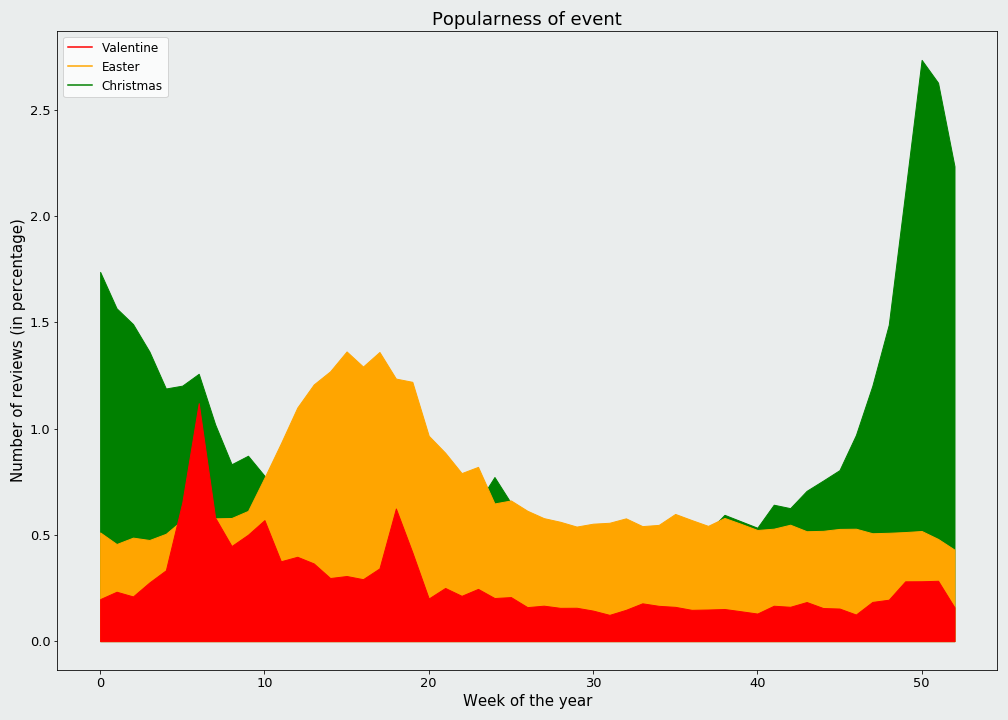
Such enthusiasm for Christmas. Indeed this event is very much popular in the United States. As we can see it occupies more than 2.5% at its peak of reviews published on the food section of Amazon and its effect last more than one month. Despite the fact that our filter to compute number of reviews is very strict since the products must mention Christmas. The other two defend theirselves pretty well too. We can see how Valentine is a punctual event, quite popular but for a very short period. On the contrary Easter is much more sparse in time, given all family events that comes around it. Another funny thing to notice is that Valentine has a little peak during Easter, and this may be due to chocolate. Indeed, chocolate is a common popular sweet for both of these events. Maybe some chocolate products are branded as both for Valentine and Easter.
Commercial events
More can be found from comments of users on food products, even information about events that do not have anything to do with food. We show here two quick studies of anomalies that we found, which conducted us to some suprising findings.
Mad Max: Fury Road
The first anomaly we found was by simply plotting the time series of the number of reviews on multiple products and see if we could capture anything interesting, let's see what they look like:
As we can see one of these products has a huge peak at during May 2015, with the most number of reviews on the 27th of May. The product is in fact a color spray and it is quite funny because most of the reviews are memes around the Mad Max movie, which released on the 15th of May. The reviews are in particular part of the 'Witness me!' meme, which comes from a famous scene of the movie. One of the protagonist sprayed his mouth and said “Witness me!”.

The popular quotes include the following:
Nux: “Witness me!”
Immortan Joe: “You will ride eternal, shiny and chrome.”
Nux: “I live, I die, I live again!”
Immortan Joe: “Return my treasures to me, and I myself will carry you to the gates of Valhalla.”
Which translated in the reviews to:
- “I BUY! I RETURN! I BUY AGAIN!!”
- “My cupcakes are all shiny and chrome. I eat, I poop, I eat again.”
- “IT BURNS OH IT BURNS WONDERFULLY THE PATH TO VALHALLA IS NOT A PAINLESS ONE”
Another funny thing to notice is that 98% of those reviews weren't verified purchases, meaning that the users most likely didn't buy it. Plus, most of these reviews have a lot of upvotes. The reviews of this product became sort of like a subreddit in a sense. This makes sense since it comes from a goup effect, initiated by a meme. It's interesting to see that we could find such an effect on Amazon food reviews and approximatively found the release date of a popular movie.
Kasandrino's olive oil
Here we were bugged by the word frequencies that we got for one year in november. Indeed when running our analysis described for the events in this period, the five first words were: 'oil', 'love olive', 'olive oil' and 'kasandrinos'. This is very surprising, why would such entousiasm for olive oil suddenly pop up ? This happened because of one product getting abnormal interest.
Indeed all of this enthusiasm was due to Kasandrinos olive oil product, how peculiar. We looked at the reviews and we were able to find a good reason for this peak. Here is a funny review to get a bit more insight:
- “I have been listening to the Balanced Bites Podcast and following Diane San Filippo for years and never actually tried the Kasandrinos Olive Oil which she refers to, raves about and recommends as the only olive oil to use. (because its amazing) I was at a friends house last weekend and she had a bottle and I got to try it and I was in olive heaven. I tasted a teaspoon and went back for a tablespoon. Its smooth, creamy, lemony, and rich and has the pure olive taste that Mediterranean food is known for. I cannot wait to purchase my own and give it away as Christmas gifts this holiday season, because who doesnt LOVE a good gift?”
It turns out that the Kasandrinos company most likely paid a lot of famous people to talk about their olive oil. For example, the Balanced Bites Podcast in the review, but we also find other people that were mentioned including: Dr. Michael Greger with Nutritionfacts.org and biophysicist Sarah Ballantyne a.k.a "The Paleo Mom".
In conclusion, carefully listen to your podcasts and don't eat olive oil with a teaspoon, go straight at it with the largest tablespoon you can find!